Ballpark dimensions are a great tool for predicting home runs in daily fantasy. I wonder, though, are some fields more advantageous than others? In a previous article, I pointed out that Petco Park actually has the second-closest distance from home plate to center field in the league – is that more or less of an advantage than far right field at AT&T Park, which is the second smallest in the league?
I’ll set up a few trends to look at the numbers and see what stands out in a moment. Before I get started, I want to mention that although Coors Field is actually one of the larger parks in terms of field size, I will not be considering it in the results because the thin air skews the results so much.
I’ll go around the horn, starting with far left field. Here are the ballparks with the shortest distances from home plate to far left:
| Park | Distance to Far Left (feet) |
| Fenway Park (*Green Monster) | 310 |
| Tropicana | 315 |
| Minute Maid | 315 |
| Yankee Stadium | 318 |
| PNC | 326 |
| Progressive | 325 |
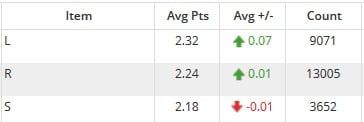
Overall, this Trend loses 0.02 points in Plus/Minus. Here are the results by handedness:
The sample sizes are rather large, so the difference is something to consider. One note about far right and far left field before we go on – I think in some ballparks, these distances can be very misleading. Due to the way the ballparks were designed, some have a short fence and then immediately arch out several feet. Angel Stadium is a good example of this:
The reading at far left in Angel Stadium is 330’, but there is only a small point at 330’ and then the fence arches back several feet. Unless a homer is hit basically right at the foul pole, there aren’t going to be very many 331’ home runs here.
Next up is left center field. I think these results will probably be a little more accurate because the distances to left center are “truer” if you believe what I just said about distances to far left and far right. Anyway, here are the parks and distances we’re looking at:
| Park | Distance to Far Left (feet) |
| Fenway Park (*Green Monster) | 335 |
| Citizens | 355 |
| O.co | 362 |
| Oriole Park | 364 |
| Great American | 365 |
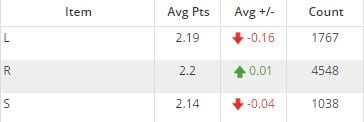
Again, because of the sample sizes, I think the differences are worth noting. Fenway is interesting because the Green Monster is so much taller but also SO much closer than any other left field in MLB. Fenway in particular adds 0.19 for lefties, making it one of the leaders in the MLB in this category.
You’d think that righties would have fared better in this category than lefties and yet they actually added .06 less to Plus/Minus. I think this is probably because lefty bats enjoy a split advantage more frequently than righties since there are more right-handed pitchers in the MLB. By applying an “Opposing Pitcher Throws L” filter to the trend, the lefties fall behind the righties:
The deep center results should be interesting because center field is the deepest part of most ballparks. Whereas the leaders in the other categories range from 310’-350’, the closest center field is 390’ and is again Fenway Park. Actually, every center field in baseball except for five (Coors, Marlins, Comerica, and Minute Maid) are within 20’ of each other (390’-410’) That makes it kind of silly to run the same queries, especially since the difference between the 4th and 12th-rated parks is two feet. The main takeaway here would be downgrading hitters whose power is to center or in games where the wind is blowing out at Marlins Park, Comerica, and Minute Maid (*center field will be brought in by several feet at Minute Maid in 2016).
Moving right along to right center field, here are the parks and distances:
| Park | Distance to Right Center (feet) |
| Citizens | 357 |
| O.co | 362 |
| PNC | 364 |
| Angel Stadium | 365 |
| Safeco | 365 |
| Great American | 365 |
The results are still bad and are close to mirroring the results to Right Center. Lefties lead the way as we get over to the right side of the field, but are losing value overall. Here is Far Right:
| Park | Distance to Far Right (feet) |
| Fenway | 302 |
| AT&T | 309 |
| Yankee | 314 |
| Oriole Park | 318 |
| PNC | 320 |
| PETCO | 322 |
| Tropicana | 322 |
I think there is one more thing we need to consider though, which is how power hitters do against shorter fields. This time, I’m only going to look at parks with short left and right center fields because I think those results will be the most telling. I’ve added the “HR per AB is between 0.04 and 0.333” filter, which roughly works out to 20 or more home runs in a season. Here is the top five parks for power hitters only (vs LH pitching):
While the Plus/Minus remained exactly the same for lefties, there was a 0.14 point increase for righties. Sounds good, right? Well, the “HR per AB is between 0.04 and 0.333” filter by itself actually added 0.21 points for right power bats against lefties, so no, that’s not good.
One last query to run, and this is the top five shortest right center fields against righty pitching with the HR/AB filter. Let’s see if the lefty power bats are able to add any value:
Nope.
So with all of the results in, batters surprisingly failed to add any notable value in ballparks that ranked in the top five for a particular field. One thing to keep in mind is that we are not talking about huge gaps in distance when comparing ballparks. Generally speaking, a difference of 10′ can separate a top five ballpark from one that lands in the middle of the pack to that field. From the results above, the 10-15′ advantage has not been enough to significantly buoy fantasy value over “the field”


