Safeco: Plus/Minus, Mostly Minus

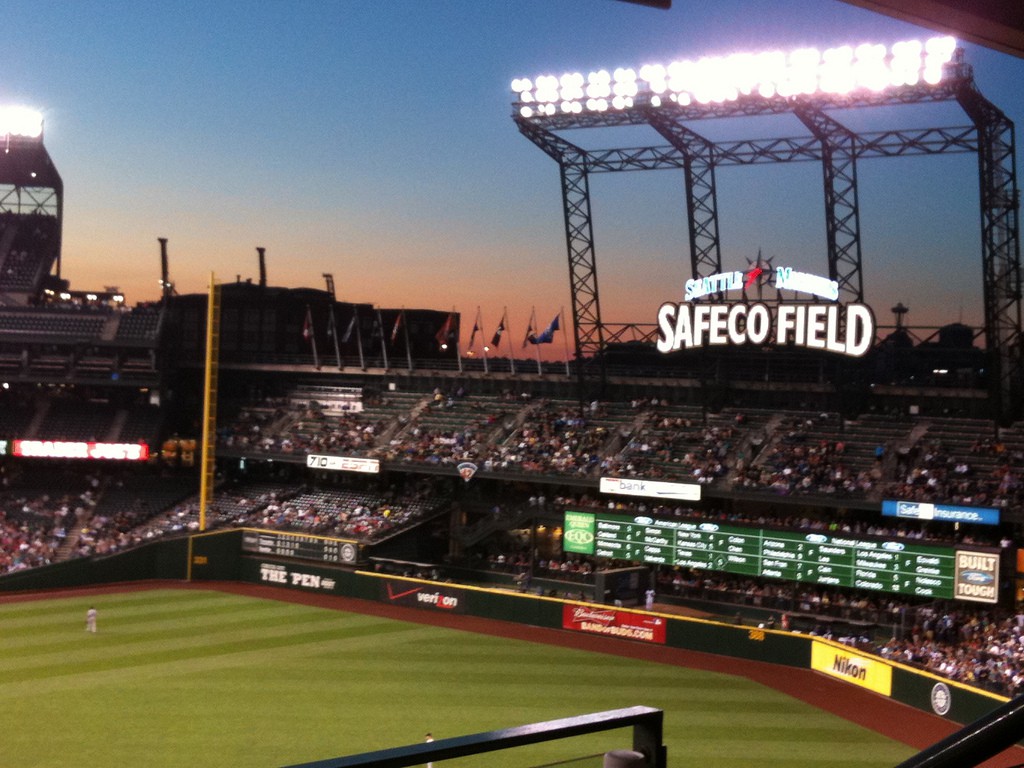
Safeco Field

The other day, I took a look at Petco Park by the numbers and found that it was among the leaders in ballpark Plus/Minus for batters so far in the 2015 season . Today, I’m going to take a look at one stadium on the other end of the spectrum. FanDuel and DraftKings both have different scoring and pricing systems, so it makes sense that Plus/Minus can rate the same players and ballparks differently depending on which site you are using. Here’s one thing they agree on – Safeco Field has the lowest Plus/Minus ranking of all MLB ballparks. (-0.8 on DraftKings and -0.36 on FanDuel).

There are two components to Plus/Minus, actual performance and projected points. So why is it that Safeco scores so poorly in this category? Let’s take a look by using some different trends. First, here is the Plus/Minus when the Vegas Percentile is 60 or better, i.e. the game has a projected total in the 60th percentile or higher:

DraftKings:

Safeco Field +/-
 

FanDuel:

Safeco Field +/-
 

Remember, the Vegas Score filter contains information about Team Run Total, Moneyline, and Vegas Line Movement, so there is a lot going on here. Overall, the Vegas Score filter grades very positively in Plus/Minus on both FanDuel and DraftKings, so it is a pretty important predictive tool, all things considered.

Two things really stick out to me here. Firstly, Safeco Field just doesn’t host games that rate highly in Vegas Score very often. It is in the bottom 5 in Count on both sites with the Vegas Score cutoff at the 60th percentile and the results only get bleaker as I move the cutoff line higher.

Second, and probably more important, when we identify a good matchup at Safeco based on Vegas Score, players have historically performed worse than we would expect them to. The other ballparks on the list differ based on site because Plus/Minus has a lot to do with pricing, but there is Safeco Field stinking it up in both screenshots.

Okay, so we know that Vegas projections are one of the better predictors we have for a player’s success in daily fantasy, but it’s not the only thing to consider. Home runs are king on both FanDuel and DraftKings, so how does Safeco correlate with our home run trends? I applied the HR per AB trend and set the cutoff to 0.05, which extrapolates to 25 home runs in a season, assuming 500 at-bats. Here is Safeco grading poorly yet again:

DraftKings:


FanDuel:


Not only is the Plus/Minus near the bottom on both sites, so is the upside rating! That means that home run hitters have collectively had less upside at Safeco Park than anywhere else in the league. The funny thing is, when you look at the actual raw ballpark statistics on MLB.com or similar, Safeco was around league-average in total home runs last season. The home runs themselves aren’t necessarily the problem – the problem is that players to meet their projections at Safeco more than anywhere else around the league, and from a DFS player’s perspective, that is a very scary thing.