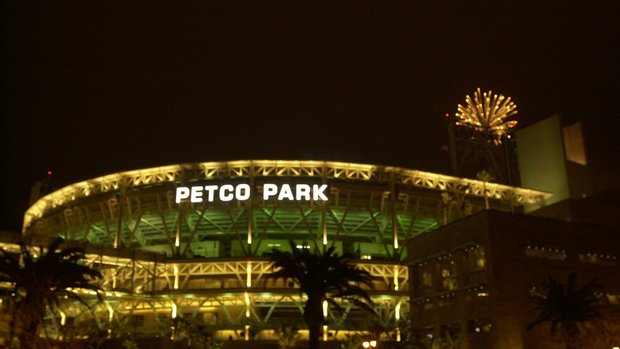
There are few things that will cool a DFS player’s daily outlook on a batter more than seeing this under the player’s matchup column: “@SD”. We think of Petco Park as the anti-Coors Field; it causes us to downgrade hitters while focusing on the pitching matchup instead. We remember the 2014 San Diego Padres, who finished 28th or worse in overall team wOBA, HR, ISO, RBI, R, and we also point out Tim Lincecum’s 2014 no-hitter at Petco as validation.
Quite frankly, I was drinking all the Petco Kool-Aid until running the following report on Frangraphs yesterday prompted me to dig a little deeper. A quarter of the way through the 2015 season, here are the MLB leaders in home wOBA:

As a brief aside, when I first saw this data, I was considering putting an article together on how awesome Brad Miller is at home. Then I pulled up a breakdown of the handedness of the opposing pitchers Brad Miller has faced in games played in Safeco on Fantasy Labs and saw this:

Yup, he has faced a righty in 95% of his home games this year. I’m going to go out on a limb and say that has skewed the results a little. Anyway, once we get past Brad The Bambino, there is Justin Upton at #5 in the league. And for good measure, here he is at #3 in the league in home ISO:

Justin Upton is great and all, but these are some monster numbers he is putting up at Petco Park so far this year. Let’s see if the trend holds up among other Padres players. Here are the splits of who I consider to be their top four hitters. Among them, Myers is the only one with better numbers on the road this year.
| Player | Home/Away | wOBA | ISO |
| J Upton | Home | .472 | .373 |
| J Upton | Away | .295 | .177 |
| M Kemp | Home | .313 | .114 |
| M Kemp | Away | .253 | .069 |
| W Myers | Home | .345 | .188 |
| W Myers | Away | .377 | .214 |
| D Norris | Home | .348 | .203 |
| D Norris | Away | .347 | .145 |
I went through the splits for players on the team last year as well. Although the numbers are a lot uglier overall, Seth Smith, Alexi Amarista, Jedd Gyorko, Yonder Alonso, and Chase Headley all hit better at Petco, while Yasmani Grandal and Everth Cabrera fared better on the road.
What specifically about Petco Park makes it such a pitcher’s paradise anyway? It must be because it’s so big. Except it’s not. The fence’s height ranges from 4-10 feet, which turns out to be very average in comparison with other parks. Here are Petco Park’s ranks in terms of distance to each wall from home plate where a ranking of 1st means shortest distance and 30th is the farthest distance among MLB parks:
| Park | Left | Left-Center | Center | Right-Center | Right |
| Petco | 18th | 20th | 2nd | 25th | 7th |
If it seems like I’ve been building up to something by referencing a bunch of supporting data, I have been. One-quarter of the way through the 2015 MLB season, here are the parks with the highest Plus/Minus rating for hitters on each site:


Not only has Petco Park not been a bad matchup for hitters, it is inside the top 10 most favorable parks on both sites, and a top 3 (!!!!) park on DraftKings. Petco Park’s dimensions were changed in 2013 to make the park more hitter-friendly. Could it be that the Padres have just been so terrible since then that it has given us the illusion that Petco is still a park that suppresses hitter production? I will leave you with one last piece of data, which shows the 2014 Padres’ total Plus/Minus scores with their home and road splits for FanDuel and DraftKings:


