At FantasyLabs, we believe that we have the best tools and data available to those who play daily fantasy sports. We also realize that these tools and data are only as beneficial as our ability to communicate their functionality and worth.
With this in mind, our “Trend of the Day” series features articles that walk subscribers through an important trend each weekday, created with our Trends tool. Also, shortly after you create a trend, you will be able to see it under the “My Trends” column in our Player Model tools.
I’m excited and you should be too. Why? Well, for starters it’s Friday and in my household that means pizza night. But outside of my wife and son, I’m guessing no one particularly cares about that. The reason all of you should be pumped is because we’re finally getting far enough into the season to start taking advantage of the new “Advanced Stats – Recent” filters. Because some of these filters have a differential component through which a player’s performance over the previous 15 days can be compared with that of the previous year, the closer we get to that 15-day mark, the more useful this data will become to us.
MLB Trend of the Day: Batters with a High Hard-Hit Differential in a Pitcher’s Ballpark
One of the filter’s I’ve found the most useful thus far when backtesting trends is the Hard Hit Differential filter. Essentially, we’re measuring the difference between how hard a player has been hitting the ball recently and how hard he has hit it over the previous calendar year. This is useful for finding value (in the form of players who have been hitting the ball hard but getting unlucky in terms of their production) and also for confirming that a player’s recent production is legitimate and not a product of a few lucky bounces. With that in mind, I want to take a look at how players with a high Hard-Hit Differential have performed under suboptimal conditions.
Step 1: Adv Stats – Recent > HH Diff Score > “95 to 100”

Step 2: Stat Filters > Opp WHIP Percentile > “0 to 25”
Step 3: Trends > Park Factor (Beta) > “0 to 33”

What we end up with is a group of players who have been hitting the ball well but are set to face off against top-shelf pitchers in pitchers’ parks. And if you look at the Plus/Minus in the upper right-hand corner of each step, we can see the trend slowly losing steam, dropping further and further from Step 1 to Step 3. With that said, let’s review the final results below.

Despite the hot-hitting ways of these hitters, it seems that the factors working against them have essentially leveled the playing field, making value tough to find. With an average Plus/Minus of +.02, this sampling of hitters would appear to be priced accurately.
This intrigues me a bit, since despite being in a seemingly negative situation — facing off against tough pitchers in parks unkind to hitters — they’re still hitting value. With the low ownership we tend to see in tournaments when players find themselves in such situations, there could be some merit to attempting to exploit this.
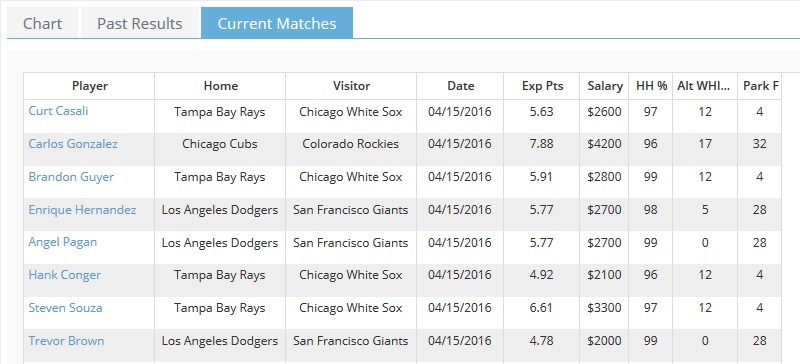
Let’s see who our matches are for today!

Keep playing around with all of the new data and see what trends you can come up with. Good luck today!


